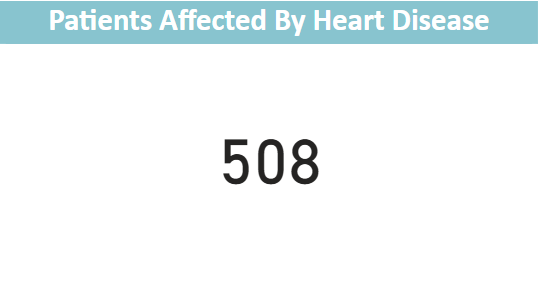
Heart Disease Analysis using MySQL & Power BI

Overview

In this project, I analyzed heart disease risk factors using a structured dataset containing patient demographics, medical history, and clinical measurements. The data was stored in MySQL, and I utilized SQL queries to extract, clean, and transform key variables related to heart disease, including cholesterol levels, blood pressure, ECG results, and exercise-induced angina. Tools & Technologies used: MySQL, Power BI, SQL, DAX

Queries with Visuals


SELECT *
FROM heart_failure_staging
WHERE HeartDisease = 1;
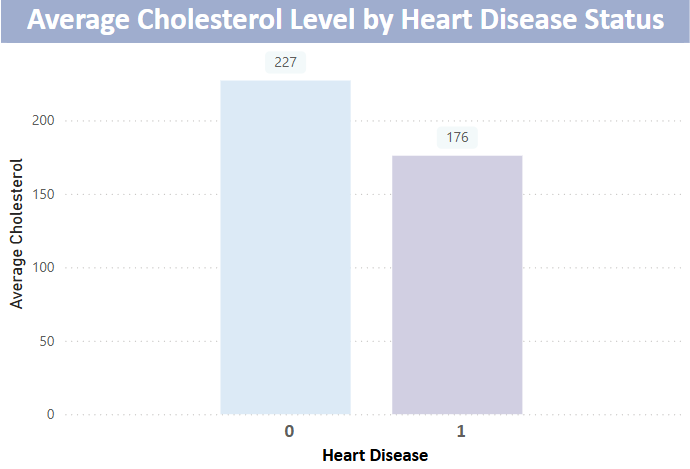
SQL query to filter patients with Heart Disease
Patients affected by Heart Disease
This displays the total amount of affected patients with Heart Disease
	
SELECT 
    HeartDisease, 
    AVG(Cholesterol) AS AvgCholesterol  
FROM heart_failure_staging  
GROUP BY HeartDisease;
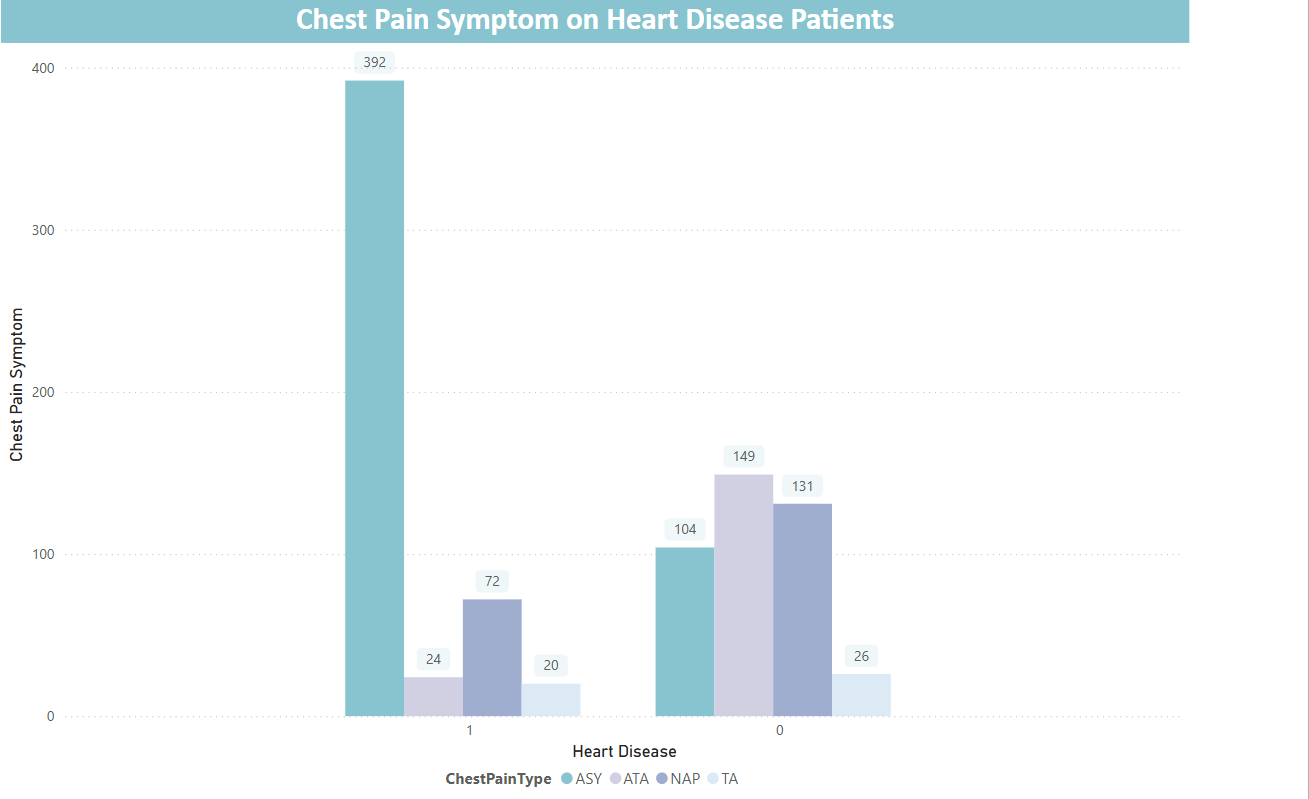
    
SQL query to filter patients with Heart Disease with average cholesterol.
Patients affected by high Cholesterol and Heart Disease
This query explains the average cholesterol in heart disease patients.
	
SELECT 
	ChestPainType,
	COUNT(CASE WHEN HeartDisease = 1 THEN 1 End) AS HeartDiseaseSymptom
FROM heart_failure_staging
GROUP BY ChestPainType
ORDER BY HeartDiseaseSymptom DESC; 
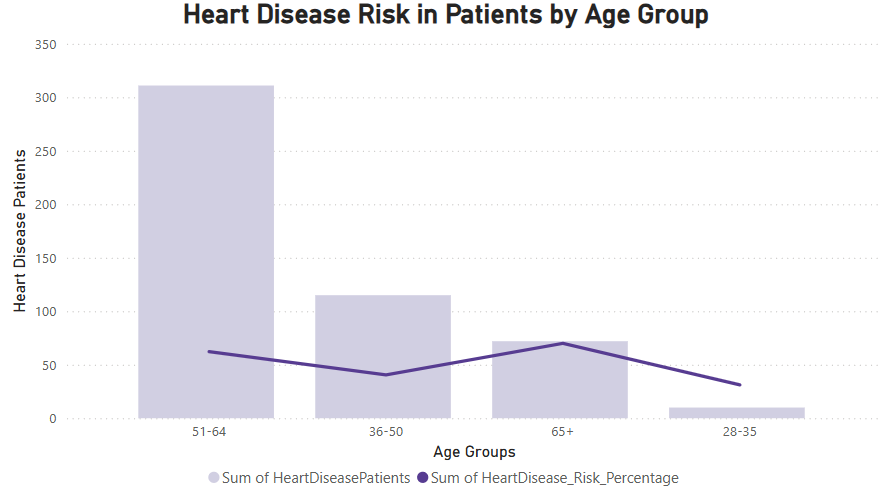

    
This SQL query analyzes the relationship between chest pain type and heart disease occurrence. It counts the number of patients diagnosed with heart disease (HeartDisease = 1) for each type of chest pain in the dataset.
Heart Disease ranked with Chest Pain
The results are grouped by ChestPainType and sorted in descending order, showing which chest pain type is most commonly associated with heart disease.
	
SELECT 
    CASE
        WHEN age BETWEEN 28 AND 35 THEN '28-35'
        WHEN age BETWEEN 36 AND 50 THEN '36-50'
        WHEN age BETWEEN 51 AND 64 THEN '51-64'
        WHEN age > 64 THEN '65+'
    END AS age_groups,
    COUNT(*) AS TotalPatients,
    COUNT(CASE WHEN HeartDisease = 1 THEN 1 END) AS HeartDiseasePatients,
    ROUND(100.0 * COUNT(CASE WHEN HeartDisease = 1 THEN 1 END) / COUNT(*), 2) AS HeartDisease_Risk_Percentage,
    ROUND(AVG(FastingBS), 2) AS AvgFastingBS,
    ROUND(AVG(RestingBP), 2) AS AvgRestingBP,
    ROUND(AVG(MaxHR), 2) AS AvgMaxHR
FROM heart_failure_staging
GROUP BY age_groups
ORDER BY age_groups;
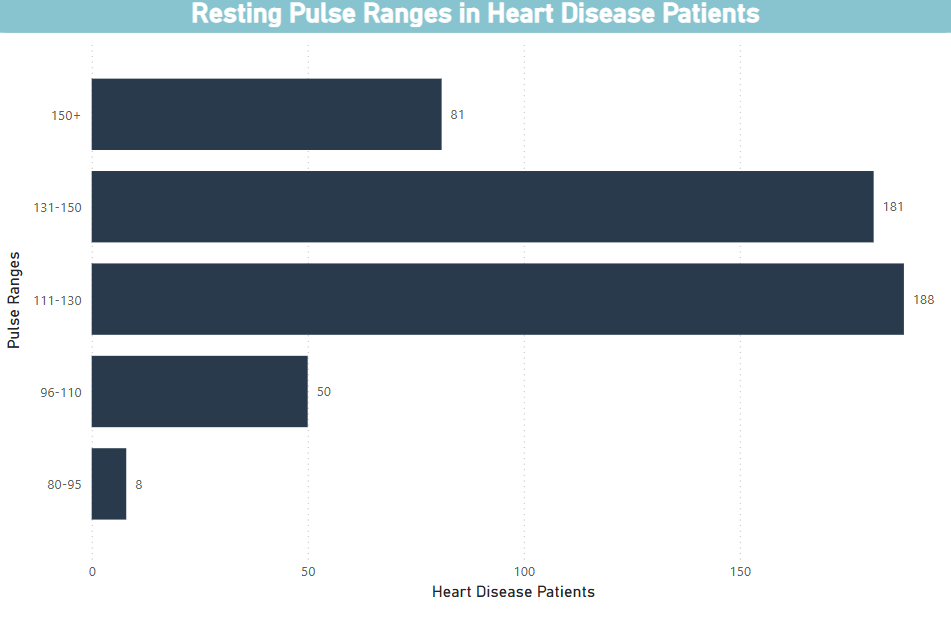
    
    
This SQL query categorizes patients into age groups and analyzes heart disease risk within each group. Grouping by age_groups ensures that the analysis is broken down by meaningful age ranges rather than individual ages. This helps in identifying trends in heart disease occurrence and risk factors among different age groups. Without GROUP BY, the query would return overall statistics instead of detailed insights per age category.
Heart Disease Risk by Age Group
The chart is a visual of the calculation with the total number of patients in each age range, the number of patients diagnosed with heart disease, percentage of patients with heart disease in each group, average fasting blood sugar (FastingBS), resting blood pressure (RestingBP), and maximum heart rate (MaxHR) for each age group. The results help identify age-related trends in heart disease risk.

SELECT 
	CASE
	WHEN restingBP BETWEEN 0 AND 95 THEN '80-95'
        WHEN restingBP BETWEEN 96 AND 110 THEN '96-110'
        WHEN restingBP BETWEEN 111 AND 130 THEN '111-130'
        WHEN restingBP BETWEEN 131 AND 150 THEN '131-150'
        WHEN restingBP > 150 THEN '150+'
    END AS restingBP_ranges,
	COUNT(*) as totalHeartDiseasePatients
FROM heart_failure_staging
WHERE HeartDisease = 1
GROUP BY RestingBP_ranges
ORDER BY totalHeartDiseasePatients ASC;
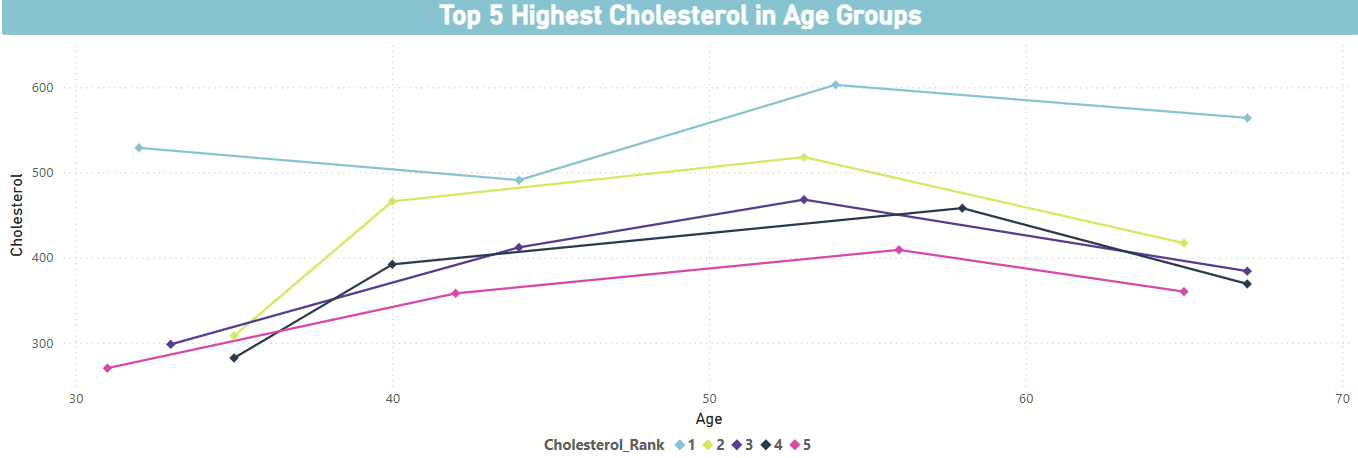
    
While GROUP BY is used to categorize patients into blood pressure ranges (so each range is treated as a unique group), ORDER BY arranges the results based on the total number of heart disease patients in each range. In this case, using ORDER BY totalHeartDiseasePatients ASC ensures that the ranges with fewer patients come first, and the ranges with the most patients appear last. This allows for easy identification of the most and least prevalent blood pressure ranges for heart disease patients. GROUP BY organizes the data, while ORDER BY defines the order in which it is presented.
Resting Pulse Heart Disease Patients
The query returns the total number of heart disease patients in each blood pressure range and organizes the results in ascending order of the count.
		
SELECT *
FROM (
    SELECT 
        Age, 
        Cholesterol, 
        RANK() OVER (
            PARTITION BY 
                CASE 
                    WHEN Age BETWEEN 28 AND 35 THEN '28-35'
                    WHEN Age BETWEEN 36 AND 50 THEN '36-50'
                    WHEN Age BETWEEN 51 AND 64 THEN '51-64'
                    ELSE '65+' 
                END
            ORDER BY Cholesterol DESC
        ) AS Cholesterol_Rank
    FROM heart_failure_staging
) ranked
WHERE Cholesterol_Rank <= 5; 

    
The RANK() function is used to assign a rank to each patient within their age group, ordered by cholesterol levels in descending order. Only the top 5 patients with the highest cholesterol in each group are selected.
Heart Disease ranked with Chest Pain
This query ranks patients within specific age groups based on their cholesterol levels, and then retrieves the top 5 patients with the highest cholesterol in each group.
		
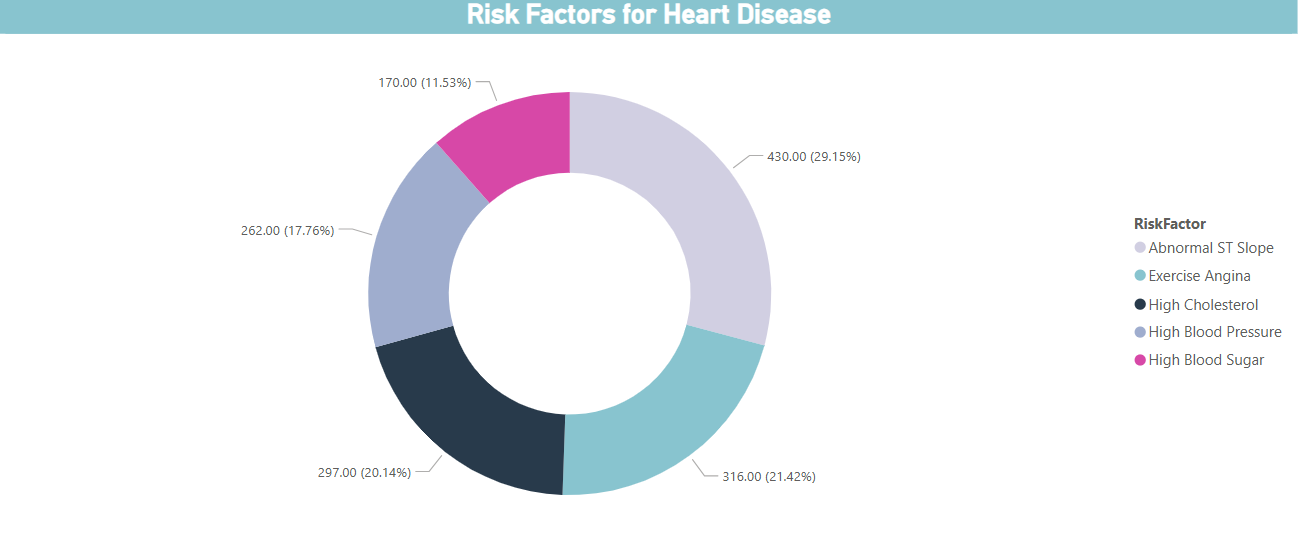
WITH HighRiskPatients AS (
    SELECT 
        HeartDisease,
        CASE WHEN Cholesterol > 200 THEN 1 ELSE 0 END AS HighCholesterol,
        CASE WHEN RestingBP > 130 THEN 1 ELSE 0 END AS HighBloodPressure,
        CASE WHEN ExerciseAngina = 'Y' THEN 1 ELSE 0 END AS ExerciseAngina,
        CASE WHEN FastingBS = 1 THEN 1 ELSE 0 END AS HighBloodSugar,
        CASE WHEN ST_Slope IN ('Flat', 'Down') THEN 1 ELSE 0 END AS AbnormalSTSlope
    FROM heart_failure_staging
    WHERE HeartDisease = 1
)
SELECT 
    'High Cholesterol' AS RiskFactor, 
    COUNT(*) AS Frequency
FROM HighRiskPatients
WHERE HighCholesterol = 1
UNION ALL
SELECT 
    'High Blood Pressure' AS RiskFactor, 
    COUNT(*) AS Frequency
FROM HighRiskPatients
WHERE HighBloodPressure = 1
UNION ALL
SELECT 
    'Exercise Angina' AS RiskFactor, 
    COUNT(*) AS Frequency
FROM HighRiskPatients
WHERE ExerciseAngina = 1
UNION ALL
SELECT 
    'High Blood Sugar' AS RiskFactor, 
    COUNT(*) AS Frequency
FROM HighRiskPatients
WHERE HighBloodSugar = 1
UNION ALL
SELECT 
    'Abnormal ST Slope' AS RiskFactor, 
    COUNT(*) AS Frequency
FROM HighRiskPatients
WHERE AbnormalSTSlope = 1
ORDER BY Frequency DESC
LIMIT 5;
 
    
This query identifies the top 5 risk factors that contribute to heart disease based on certain medical conditions in patients who already have heart disease. The query first uses a Common Table Expression (CTE) to classify patients with heart disease based on several conditions like high cholesterol, high blood pressure, exercise angina, high blood sugar, and abnormal ST slope. Then, it calculates how many patients exhibit each risk factor and selects the top 5 most frequent risk factors.
Heart Disease Risk Factors
The chart

If you want to see the complete project, download these files.

Download SQL Queries

Download Power BI Dashboard

Refrences for Queries and Charts

1. Age: age of the patient [years] 2. Sex: sex of the patient [M: Male, F: Female] 3. ChestPainType: chest pain type [TA: Typical Angina, ATA: Atypical Angina, NAP: Non-Anginal Pain, ASY: Asymptomatic] 4. RestingBP: resting blood pressure [mm Hg] 5. Cholesterol: serum cholesterol [mm/dl] 6. FastingBS: fasting blood sugar [1: if FastingBS > 120 mg/dl, 0: otherwise] 7. RestingECG: resting electrocardiogram results [Normal: Normal, ST: having ST-T wave abnormality (T wave inversions and/or ST elevation or depression of > 0.05 mV), LVH: showing probable or definite left ventricular hypertrophy by Estes' criteria] 8. MaxHR: maximum heart rate achieved [Numeric value between 60 and 202] 9. ExerciseAngina: exercise-induced angina [Y: Yes, N: No] 10. Oldpeak: oldpeak = ST [Numeric value measured in depression] 11. ST_Slope: the slope of the peak exercise ST segment [Up: upsloping, Flat: flat, Down: downsloping] 12. HeartDisease: output class [1: heart disease, 0: Normal]